
Week of October 25, 2026 · Issue #2
The odds lean higher, but not for everyone
This week's verdict: the index odds lean higher, but the typical stock is a coin flip.
How to read this letter
Every Friday after the close, Probability Trader Pro's models look at about 280 stocks and more than two dozen funds. For each one, they estimate the odds that it will be higher a week from now, even by a penny. The models learned from years of each stock's own price and volume history. They don't read headlines. They read how prices behave.
A 50% reading is a coin flip. Above 50% leans higher; below 50% leans lower. These are odds, not promises: a 70% call still misses about 3 times out of 10.
This letter isn't about any single stock. It's about the market as a whole: which way the odds lean, how many stocks share that lean, and how last week's odds actually turned out.
1. The Big Picture: Next Week's Odds
All three major index funds lean higher going into next week:
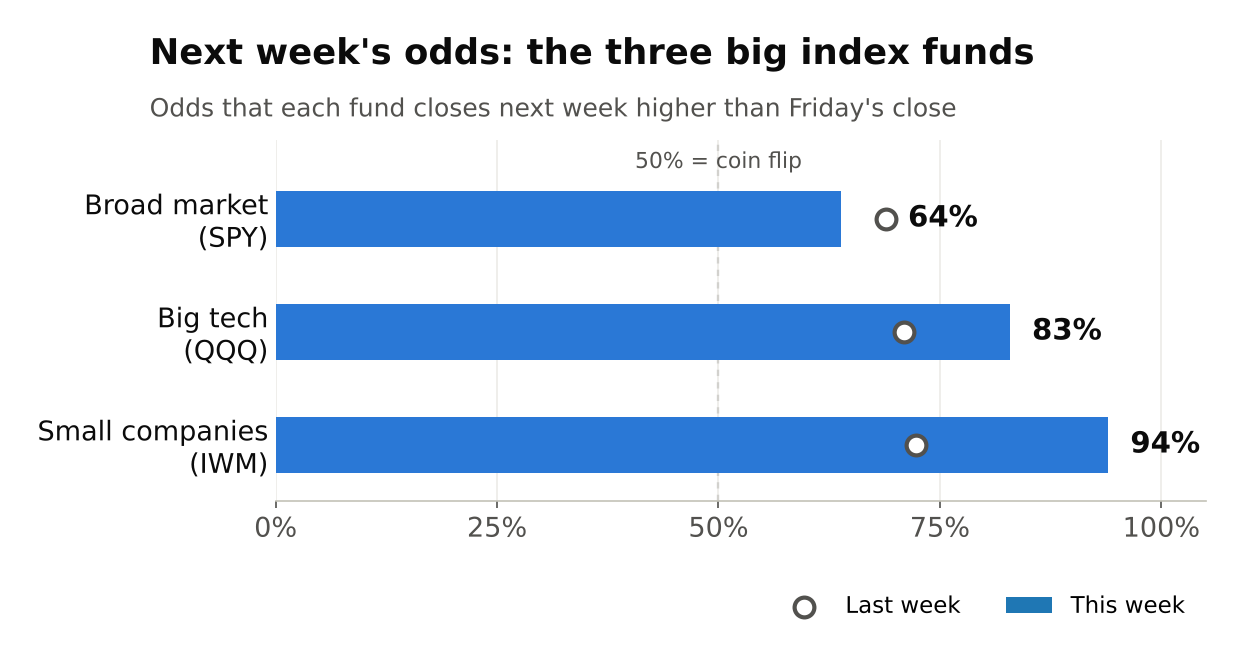
- Small companies (IWM, Russell 2000): 94%. The strongest of the three, up from 72% last week.
- Big tech (QQQ, Nasdaq 100): 83%, up from 71%.
- The broad market (SPY, S&P 500): 64%, slipping a bit from 69%.
How bad could a normal week get? We also look at how far each fund has fallen in a typical week. Over the past five years, in 9 weeks out of 10 the S&P 500 fell no more than about 2.4% from one Friday to the next. From Friday's close of 759.97, that puts its "bad-week floor" near 742. For the Nasdaq 100 the figure is about 3.5% (near 680), and for small caps about 3.3% (near 267). A drop below those levels isn't impossible. It would just be unusual, the kind of thing that happens about one week in ten.
2. Under the Hood: Is Everyone Joining In?
A handful of giant companies can push an index fund around. So we also look at the individual stocks underneath.
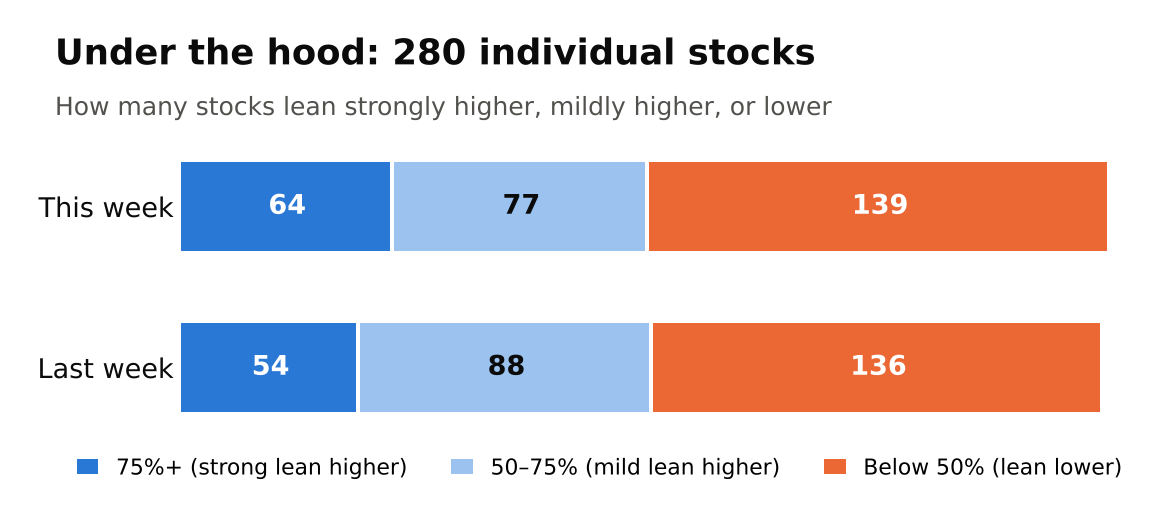
This week that picture is much more mixed. The average stock we follow sits at 50%, a pure coin flip, and about half of them (139 of 280) lean lower. Only 64 stocks are at 75% or better.
There's also a lot of reshuffling. About 110 stocks saw their odds jump this week, and about 110 saw them drop. When that many stocks trade places, the market hasn't settled on a direction.
The clearest sign: the regular S&P 500 fund is at 64%, but the equal-weight version, where every company counts the same from the largest to the smallest, is at just 23%. In plain terms, the biggest companies are carrying the optimism. The typical company isn't.
3. Where the Odds Are Moving
Leaning higher
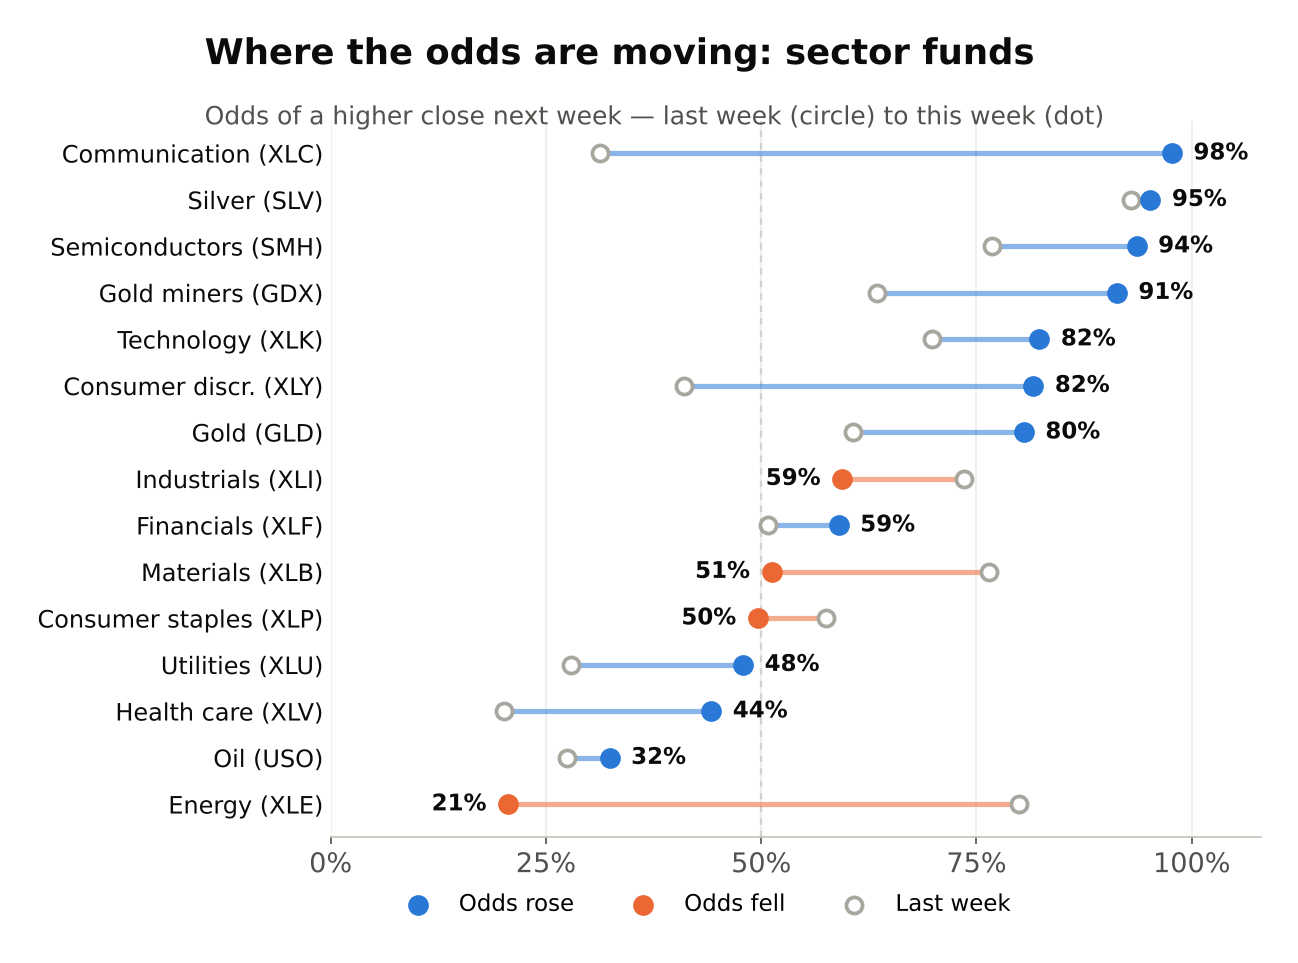
- Communication services (XLC) jumped from 31% to 98%, the biggest turnaround of the week.
- Consumer discretionary (XLY) doubled, from 41% to 82%.
- Technology and semiconductors stay strong: XLK at 82%, SMH at 94%.
- Precious metals are firmly in favor: silver 95%, gold miners 91%, gold 81%. Materials stocks as a group rose about 10 points.
Leaning lower
- Energy had the sharpest reversal, falling from 80% to 21%. Oil (USO) is at 32%.
- Transportation stocks dropped about 10 points, to 39%.
- Health care, consumer staples and utilities all sit below 50%.
The theme this week: the odds favor growth and metals, and they are cooling on energy and the defensive groups.
4. Trend vs. Odds: Do They Agree?
The odds tell us where things may go next week. The trend tells us where they've been going. This week the two disagree, and that's worth understanding.
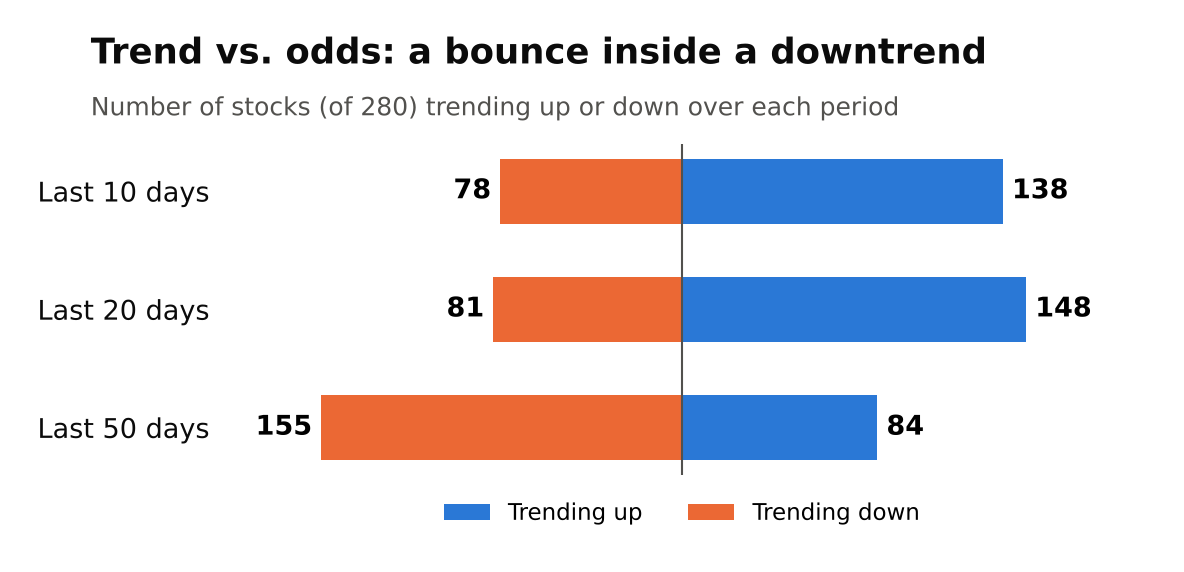
Looking back 50 trading days (about ten weeks), more than half the stocks we follow (155 of 280) are in a downtrend. Only 84 are in an uptrend. But over the last two weeks the short-term trend has flipped, and most stocks are moving up again.
That's what a bounce inside a longer decline looks like, and the odds are betting on the bounce. Of the 64 stocks with odds of 75% or better, 45 are in longer-term downtrends.
That fits how the models tend to behave. They often expect stocks that have fallen far from their usual levels to snap back. In a calm market, that works well. In a market driven by news (tariffs, war, rate surprises), stocks can keep falling longer than history suggests. That has been the challenge for much of this year, and it's the main risk to this week's outlook.
5. What Could Change the Picture
Several big events land next week. Any of them can override what price history says.
- Wednesday: the Federal Reserve announces its interest-rate decision.
- Wednesday after the close: Microsoft and Alphabet (Google) report earnings. With big tech carrying so much of the index odds, these matter.
- Thursday: the first look at third-quarter economic growth (GDP) and the Fed's preferred inflation measure. Amazon reports after the close.
- Friday: the Bank of Japan's rate decision.
- Any day: tariff and Middle East headlines.
6. Report Card: How Did Last Week's Odds Do?
We grade ourselves every week, good or bad.
Last Friday all three index funds leaned higher. Two of the three missed:
- S&P 500 (SPY): 69% odds, finished down 0.4%. Miss.
- Nasdaq 100 (QQQ): 71% odds, finished down 0.8%. Miss.
- Small caps (IWM): 72% odds, finished up 2.0%. Hit.
None of them came close to its bad-week floor.
It was a rough week for the odds on individual stocks. Overall, 57% of the stocks we follow finished higher. But the stocks with the strongest odds (75% or better) lagged: only 20 of 54 finished higher. The stocks the odds leaned against did better, and 61% of them rose.
That's exactly the kind of week section 4 warns about: when the market moves on news, the stocks that "should" bounce sometimes don't. We'll keep reporting the misses alongside the hits, because odds only mean something if you can see how they've done.
Probability figures are PTP model outputs. Economic and company figures are from the sources cited. Educational research, not investment advice. Probabilities are historical estimates, not guarantees. The author may hold positions in securities mentioned.